Introduction
Needed Components
- Jakarta.jmeter.com
- jdk 1.5
- java homepath
- java classpath
What is Jmeter?
- Load testing framework
- HTTP, FTP, SOAP
- JDBC connector
Performance Testing
- Users
- Data
- Time
Performance Testing Facets
- Load – concurrency
- Stress – Overload system, activity
- Scalability/Capacity – Find limit/breaking point
- Volume – Data throughput
- Endurance – test for long hours
- Load Runner
- Silk Performer
- SAP, Oracle Apps, Flex
JMETER Testplan WalkthRough
Steps
- Login and Post a request
- Record
- Setup your proxy
- Put each group in to a new controller
- Add a recording controller
- Add HTTP requiest defaults
- Set defaults\
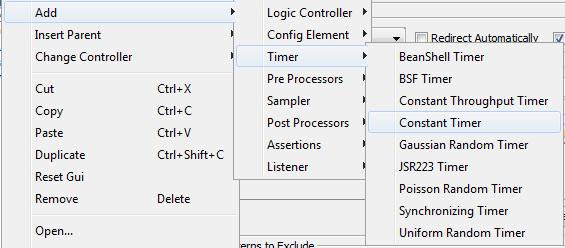
- Add a constant timer
- Add a ‘View Results in Tree’ listener
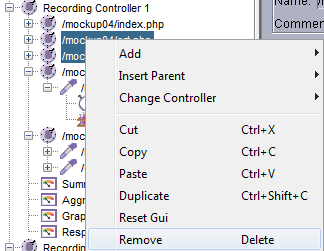
- Clean
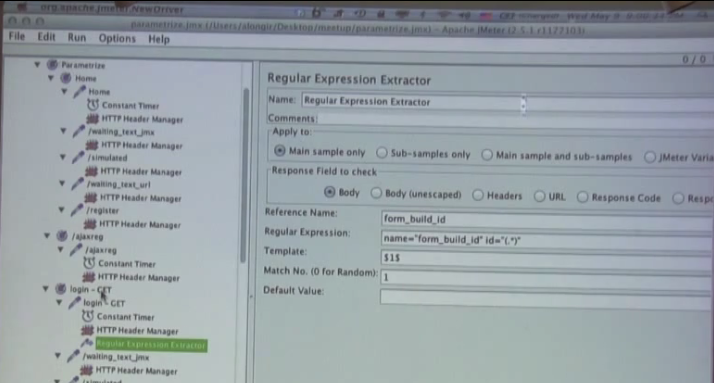
- Parameterize
- Debug
- Test
- Analyze Report
Test Plan
New Test Plan

- Test Plan has different levels of Scope ( i.e. Parents/Children )
- Each Node can be saved as a separate JMX file for plug’n’play style script building
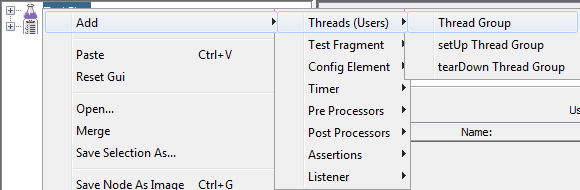
Add Thread Group(s)
- Top Level of Script since a Thread = User
- User different Thread Groups to perform different task sets
- Thread groups will each do their own set of tasks so a Test plan will have several Thread Groups to run through various tests sequentially
Add Config Element\HTTP Request Defaults
- Configures the HTTP Request, but does no action
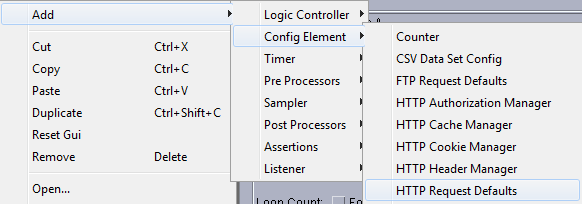
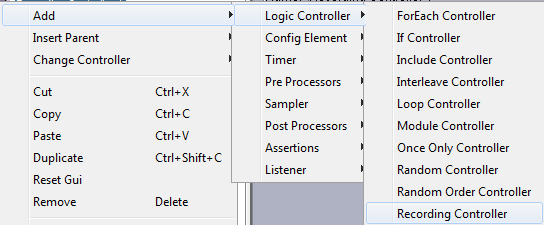
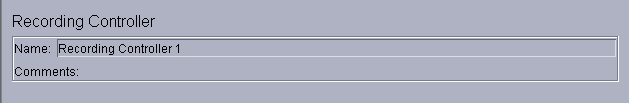
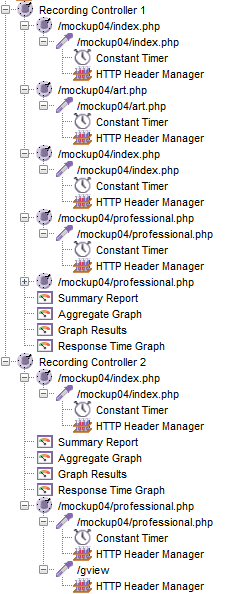
Add Recording Controller
- Simply a container for the data collected during the test run, such as pages, and graphical elements the pages request
Workbench
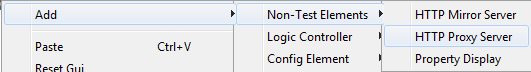
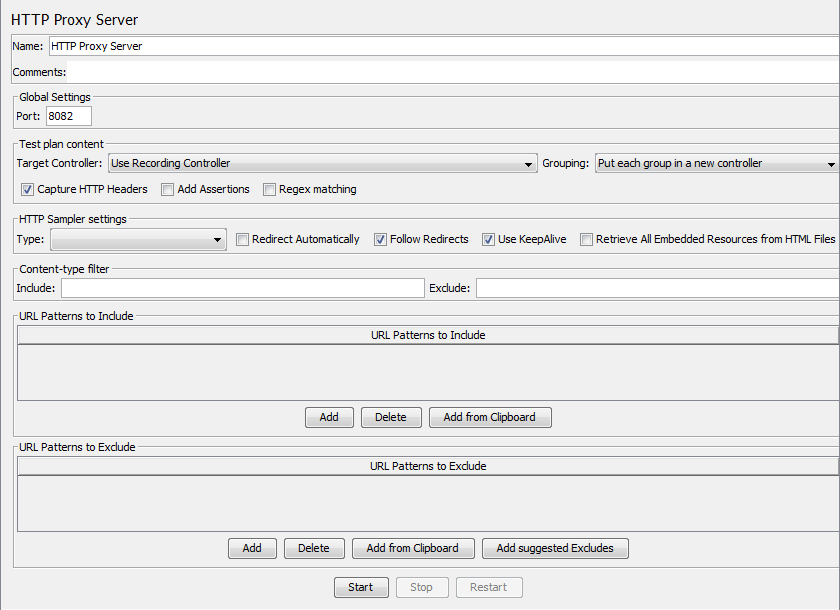
Add HTTP Proxy Server
- Configure Browser to go through port 8080 (or some other port number )
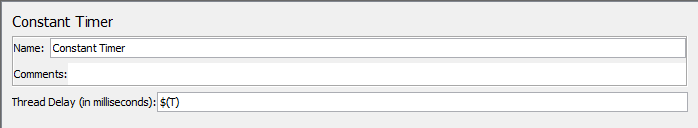
Add Timer\Constant Timer
- $(T) = Time user’s actions and use that instead of a set number of ms
- $ is a variable indicator
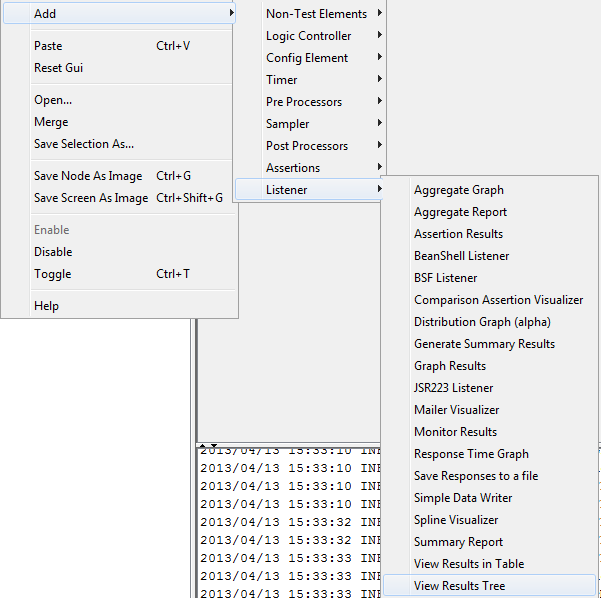
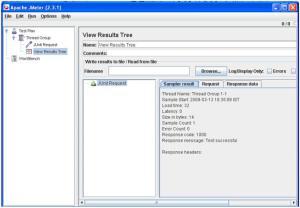
Add Listener\View Results Tree
RUN and CAPTURE
START Proxy and Run Requests through a browser at Proxy Port
- Proxy is running
- Open browser and go through designated port
- JMeter will record pages/requests into the Recorder Controller
- JMETER is ready to record
- Controller is a set of
- Capture Everything, Clean, then Tweak
Capture
Clean
Parameterize
RUN and Debug
Set Browser to use Proxy Server on Designated Port
Check Recording Controllers when done
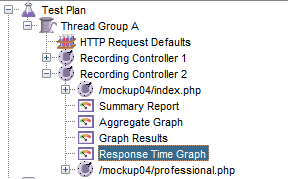
Reports and Graphs
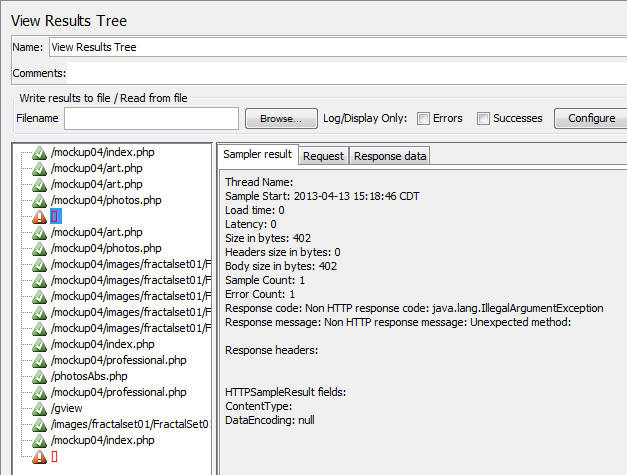
Results Tree
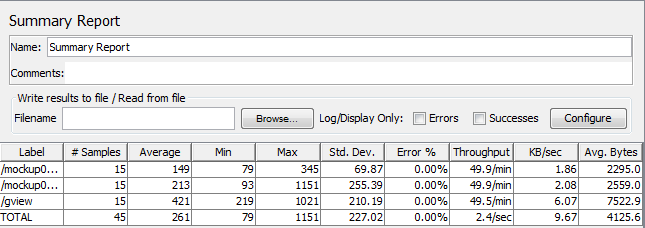
Summary Report
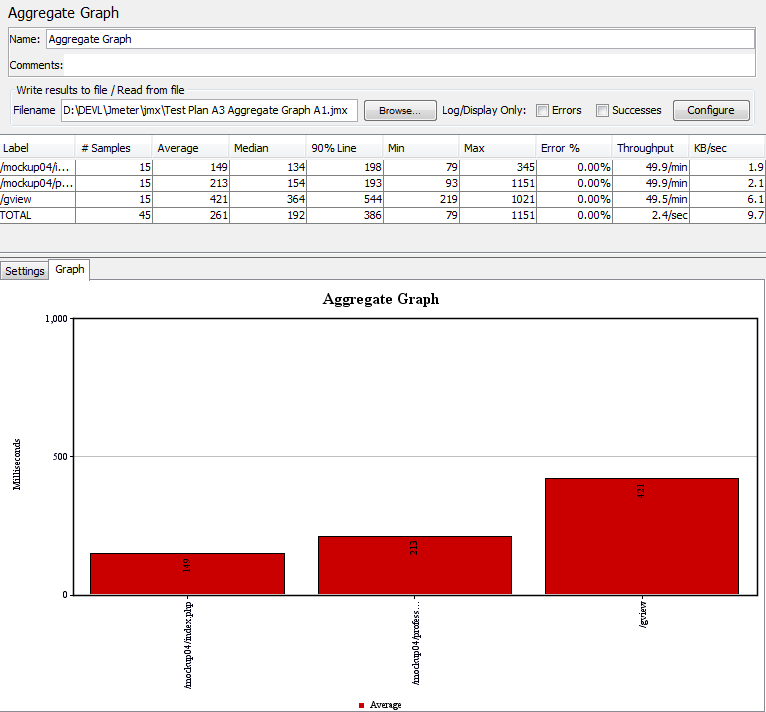
Aggregate Graph
Graph Results
Response Time Graph


JMeter Tutorial @infosecinstitue.com
Part1
1. Introduction
Apache JMeter is a program that can test the performance of various servers. It natively supports the following protocols:
- HTTP(S)
- LDAP
- JMS
- SOAP
- JDBC (needs appropriate JDBC driver)
- SMTP(S)
- POP3(S)
- IMAP(S)
Besides those, JMeter also has a lot of plug-ins that can be used to test the performance of other services implementing other protocols not described above. Most of them (but not all) can be found on the jmeter-plugins web site. After downloading and installing the jmeter-plugins package, new entries will appear in the graphical user interface menu in JMeter.
After downloading the JMeterPlugins, we need to extract it:
|
1 2 3 4 5 6 7 8 9 |
# mkdir JMeterPlugins
# mv JMeterPlugins-0.5.3.zip JMeterPlugins/
# cd JMeterPlugins
# unzip JMeterPlugins-0.5.3.zip
# cp JMeterPlugins.jar ../apache-jmeter-2.7/lib/ext/ |
After that we just need to restart the JMeter and the jmeter-plugins should be loaded just fine. This works because JMeter automatically searches for classes in the /lib and /lib/ext directories. The /lib directory contains utility jars, whereas the /lib/ext directory contains JMeter components and add-ons.
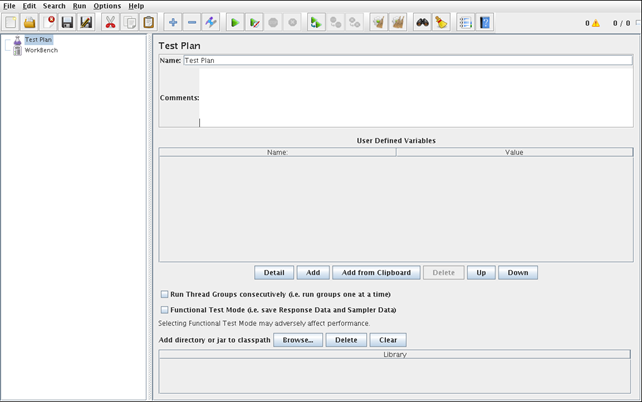
When we start JMeter, its user interface will look like the picture below:
2. Test Plan
A test plan in JMeter specifies the steps the JMeter will test when it is run. There are various elements that can be added into the test plan, each of which is responsible for certain aspects of the test process. When the JMeter is loaded it can’t do anything by default, because there are no test elements added to the test plan; the test plan is empty. To add appropriate elements we must first know what we would like to test. If we’ll test a HTTP server we must add different elements than if we’re going to test a LDAP server. But some of the elements are mandatory and must be used regardless of the testing server. Those elements are the following:
- Thread Group
- Logic Controller
- Listener
- Timer
- Assertion
To add elements to a Test Plan we must right-click on the “Test Plan” and choose “Add” for a menu of elements to become available. There are a number of element groups, which we’ll describe later.
The first thing we should do when defining a Test Plan is to save it to some file, so we don’t lose the already configured options later. To do that, we must click on Menu – File – Save Test Plan as and save it. This is shown in the picture below:
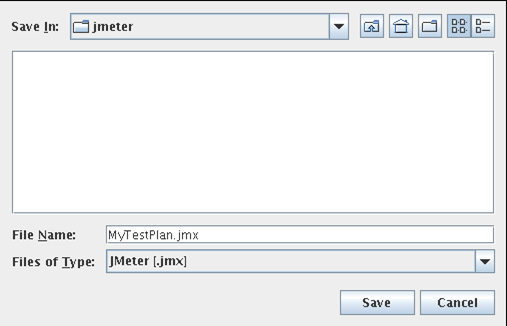
Alternatively we could do the same thing by right-clicking on the “Test Plan” and selecting “Save Selection As” and save the Test Plan. Here we must also mention that we don’t necessarily have to save a whole Test Plan, but can also save a subset of a test plan, which can prove useful if we only want to save a specific element we would like to later import into all test plans.
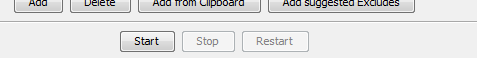
To run the test plan, we could click the Menu – Run – Start or a green play icon in the toolbar menu; those two are equivalent.

Notice the green play icon in the above picture; it’s a Start button. On the right side of the picture there are some numbers and a little square. The square notifies us whether the JMeter is running or not. In the above picture we can see that the square isn’t colored, which indicates that the JMeter was not running at the time the picture was taken. If the square had been green, it would mean that the JMeter is running.
The numbers to the left of the square are the number of active and the number of total number of threads.
Let’s now look at the Test Plan options that we can configure. They are shown in the picture below:
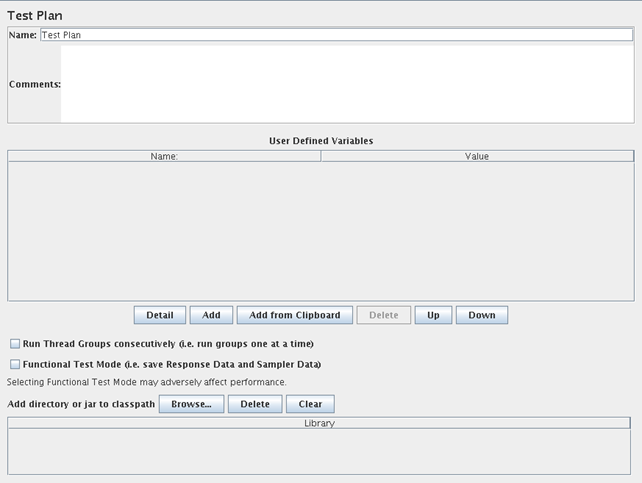
Okey, first we can name our test plan, which by default is simply “Test Plan”. We can also provide a description of our test plan, but this isn’t required. After that there is a little space for user defined variables, which can be used to replace a variable with some static string when the test is being run. Those variables can be used in any test plan element, except for the test plan itself. An example of defining a variable is the IP address of the HTTP server being tested. We can assign an IP address a certain variable name, which can then be used in all the test elements. When we would like to test another server, we would only have to change the IP of that variable and not all the values of the test elements which use the IP address for testing.
If we would like to test the Google DNS server, we could define the variable name host as shown in the picture below:
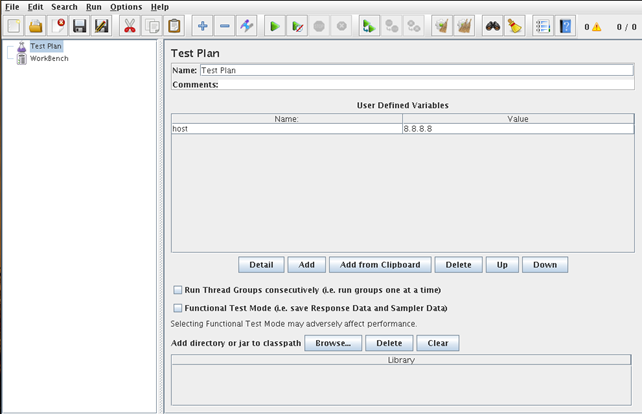
Then we would need to reference the IP address of the Google DNS server by using a host variable and not by using the IP address directly.
Want to learn more?? The InfoSec Institute Ethical Hacking course goes in-depth into the techniques used by malicious, black hat hackers with attention getting lectures and hands-on lab exercises. While these hacking skills can be used for malicious purposes, this class teaches you how to use the same hacking techniques to perform a white-hat, ethical hack, on your organization. You leave with the ability to quantitatively assess and measure threats to information assets; and discover where your organization is most vulnerable to black hat hackers. Some features of this course include:
- Dual Certification - CEH and CPT
- 5 days of Intensive Hands-On Labs
- Expert Instruction
- CTF exercises in the evening
- Most up-to-date proprietary courseware available
There are also other options in the Test Plan. “Run Thread Groups Consecutively” runs groups one at a time and not in parallel. The “Functional Test Mode” saves the data returned from the server for each request in a file as defined in a test listener. This should only be used when testing our configuration options to ensure that JMeter is functioning properly. We shouldn’t enable that option when stress testing because each response will be saved into the file on disk, which decreases the performance of JMeter considerably. We defined a test plan for InfoSec Institute where only one request would be sent with the “Functional Test Mode” turned to on, just to see what will be written into the filename that should store the responses of requests. After running the test plan, the filename looks like the output below:
|
1 2 3 4 5 6 7 8 9 10 11 12 13 14 15 16 17 |
<?xml version="1.0" encoding="UTF-8"?>
<testResults version="1.2">
<httpSample t="960" lt="369" ts="1346340056672" s="true" lb="HTTP Request" rc="200" rm="OK" tn="Thread Group 1-1" dt="text" by="35425">
<responseData class="java.lang.String">[RESPONSE]</responseData>
<cookies class="java.lang.String"></cookies>
<method class="java.lang.String">GET</method>
<queryString class="java.lang.String"></queryString>
</httpSample>
</testResults> |
I didn’t provide the response of the above request into the printed output for clarity, but I’ve marked where the response should be with [RESPONSE]. The [RESPONSE] should simply contain the HTML code of the default InfoSec Institute web page. We can see that the “Functional Test Mode” functionality works and does what it promises, but if the option would be enabled when stress testing, the JMeter’s performance would be degraded.
Lastly we can also add our own directory to a classpath, which means that if we write a plug-in for JMeter we don’t need to copy it to the /lib/ext directory in the JMeter home directory, but we can select the directory of our choosing and JMeter will recognize it and load the plug-in correctly.
3. Conclusion
In the next part we’ll take a look at the JMeter elements and describe them in detail. We’ll also describe the execution order and scope of the JMeter elements.

Part2
1. Test Plan Elements
Up until now we haven’t said anything about how to actually do something useful with JMeter, but it’s only because we need to cover some boring details of how to configure it before actually running some performance testing.
The picture below introduces the elements we can use in JMeter performance testing program:
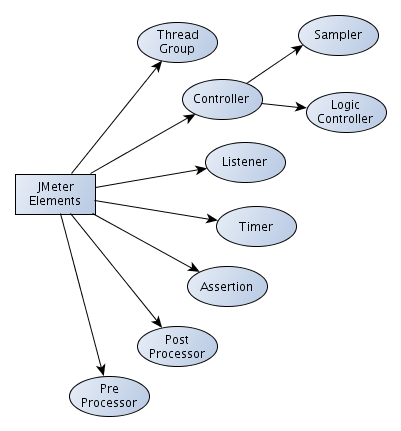
We can see that there are the following elements that we can use:
- Thread Groups
- Controllers (Samplers, Logic Controllers)
- Listeners
- Timers
- Assertions
- Post Processors
- Pre Processors
Let’s describe the elements a little bit further.
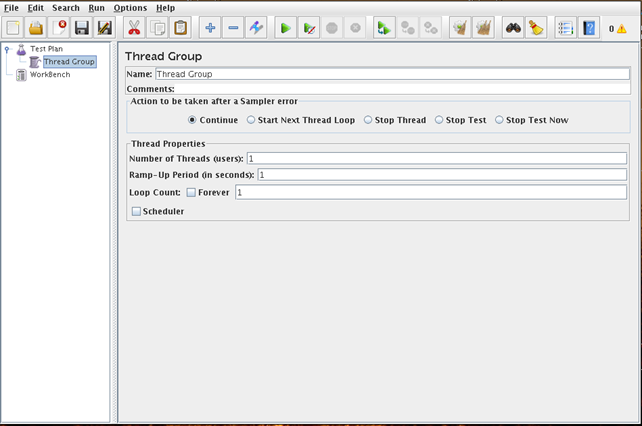
1.1. Thread Groups
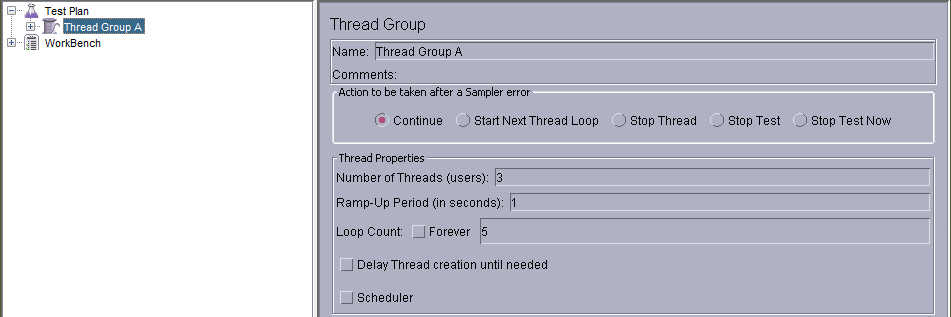
Thread group element states the beginning of each test plan and is a mandatory element. The next picture shows the configuration settings of a thread group element.
The first option allows us to name the thread group. It’s named as “Thread Group” by default. The next option is what should happen when the Sampler fails. Samplers provide JMeter with functionality like sending requests to a server and waiting for a response. Thus we can choose from the following actions if sending a request or receiving a response fails: Continue, Start Next Thread Loop, Stop Thread, Stop Test, Stop Test Now. I guess the actions are self-explanatory, which is why we won’t describe them further.
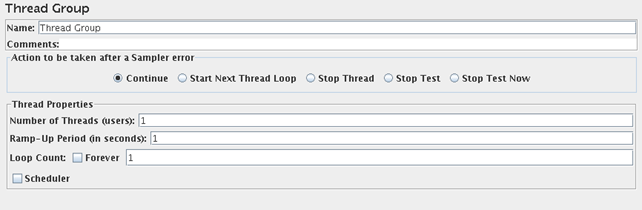
After that comes a very important section, which we must understand correctly.
- Number of Threads (N): Sets the number of threads the JMeter will use to execute our test plan. We must know that each thread will execute the whole test plan, which effectively utilizes the number of users that could use the tested service at any given time simultaneously.
- Ramp-Up Period R: Specifies how much time (in seconds) it will take for JMeter to start all the threads (simultaneous user connections). If the number of users is 5 and the ramp-up time is 10 seconds, then each thread will be started in a 2 second delayed interval. We need to be careful when setting this value, because if the value is too high the first thread will already finish processing the whole test plan before the second thread will even begin. This is important because that would effectively reduce the number of concurrent users using the testing server application at any given time. But the ramp-up period also needs to be high enough to avoid starting all of the thread at a single time, which could overload the target application.
- Loop Count (L): How many times each thread group will loop through all configured elements belonging to that thread group.
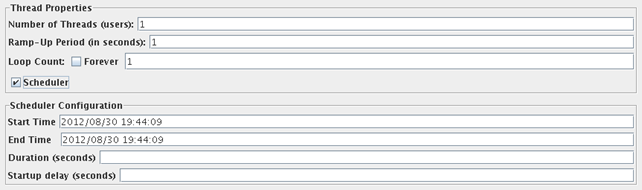
At the bottom of the thread group is also a “Scheduler”, which can be used to set the duration, starting and ending point of a test scan. This can be seen in the picture below:
1.2. Controllers
There are two types of controllers: samplers and logical controllers.
1.2.1. Samplers
Samplers are used to send requests and wait for response. The requests can be pretty much any type, from an HTTP request to a LDAP request. If we take a look at the HTTP request sampler, we can see that there are quite a few options that we can set; we can see that in the picture below:
Some of the more important options we can set in the HTTP sampler are the following:
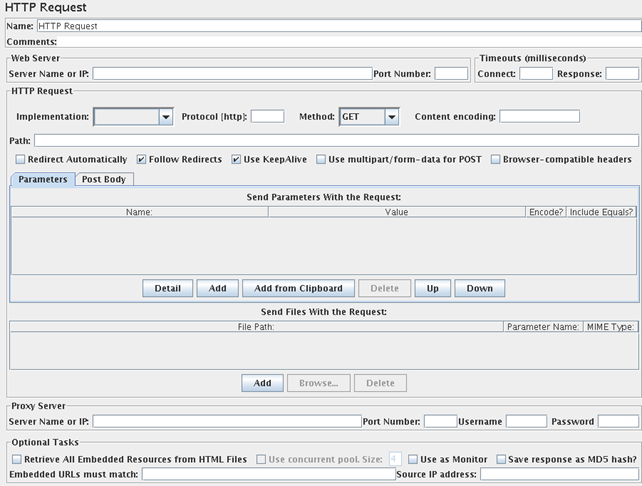
- Server Name or IP: this must be set so that JMeter knows where to send requests (which target application is being tested).
- Port number: the port number is 80 by default, but we can set it to any value if our HTTP server is running on a different port.
- Path: here we can specify the resource path we would like to access, like /index.html or something like that. We can also add various GET/POST parameters with each request or use a Proxy server to send requests through it.
1.2.2. Logic Controllers
Logic controllers are used to specify when to send the requests, change the requests, change the order of sending the requests, etc. Basically they control how samplers are processed and executed.
1.3. Listeners
Listeners save the responses on issue requests for later analysis. There are numerous listeners that can analyze the results and present them on the graph or something. So far, we already talked about listeners having an option for saving the responses in a csv/xml file, but here we’ll take a look at listeners in detail.
To view the results of any kind of sampler we need to add one of the following two listeners:
- View Results in Table
We can see that listener in the picture below:
Basically we don’t need to configure the “View Results in Table” element, but we can set a couple of options like the name and description of the element and the filename where to save the responses. Below that is where the graph will be drawn.

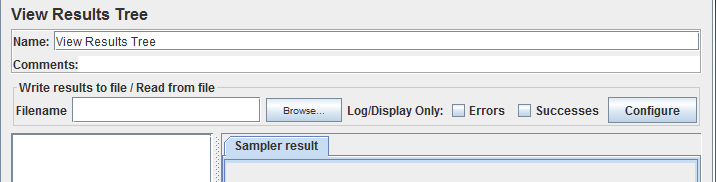
- View Results Tree
We can see that listener in the picture below:
Again, there is really nothing complicated about that; we can leave the listener as it is and it will work just fine, no configuration is necessary.

1.4. Timers
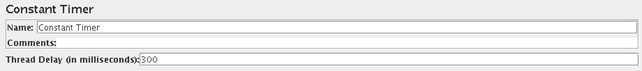
By default JMeter sends requests without waiting between each request. It’s advisable that we add a delay element to a Thread Group, which will delay the sending of each request. We can do that by introducing a new Timer element, which will ensure that requests will be sent in a timely fashion, so that not too many requests are sent at a time, which can overload the server application. If there are multiple timers in the scope, the addition of all of them is being used.
We can add a custom timer as shown in the picture below, which delays each thread by 300 miliseconds.
1.5. Assertions
With assertions we can check whether a response contains an exact string we’re looking for. We can see the results of an assertion if we add an Assertion Listener to a Thread Group. We can see an Assertion Listener in the picture below:
1.6. Configuration Elements

The configuration elements are being used to additionally change the behavior of Sampler elements. The configuration elements can’t make new requests, but can change the requests already being produced by a Sampler.
1.7. Pre-processor Elements
Preprocessor elements can execute some action before a Sampler sends a request to the target application, which is why we must add these elements to the Sampler elements.
1.8. Post-processor Elements
Postprocessor elements are executed after the requests have been sent and a response received. We can use post-processor elements to extract some data from the response.
2. Scope and Execution Order
We didn’t yet talk about the execution order and the scope of the JMeter elements. The execution order and the scope are important features to understand when adding new elements to the test plan.
First we must talk about the scope of the elements. We’ve seen that we can add arbitrary elements to each other element, so understanding the scope is really important. First we must know that it’s the Logical Controllers and Samplers that are the primary elements being used. All the other elements are applied to the Logical Controllers and Samplers.
The Sampler elements are executed the way they appear in a tree regardless of the hierarchy of them. Some of the Logical Controllers can change the execution order of their child Sampler elements, but that is more an exception than a rule. This is why when determining which requests the test plan will execute, we must first look at subsequent Sampler elements. Then we must apply other hierarchical elements to it, namely: Listeners, Config Elements, Pre-processor Elements, Post-processor Elements, Assertions, and Timers.
We know that all these elements are being applied to Logical Controller or Sampler elements, which is why we must determine what elements belong to which. Additionally, Samplers can be added to Logical Controllers and all the elements of a Logical Controller are then applied to its Samplers.
Thus if we have the example presented in the picture below:
Want to learn more?? The InfoSec Institute Web Application Penetration Testing Boot Camp focuses on preparing you for the real world of Web App Pen Testing through extensive lab exercises, thought provoking lectures led by an expert instructor. We review of the entire body of knowledge as it pertains to web application pen testing through a high-energy seminar approach.
The Web Application Penetration Testing course from InfoSec Institute is a totally hands-on learning experience. From the first day to the last day, you will learn the ins and outs of Web App Pen Testing by attending thought provoking lectures led by an expert instructor. Every lecture is directly followed up by a comprehensive lab exercise (we also set up and provide lab workstations so you don't waste valuable class time installing tools and apps). Benefits to you are:
- Get CWAPT Certified
- Learn the Secrets of Web App Pen Testing in a totally hands-on classroom environment
- Learn how to exploit and defend real-world web apps: not just silly sample code
- Complete the 83 Step "Web App Pen Test Methodology", and bring a copy back to work with you
- Learn how perform OWASP Top 10 Assessments: for PCI DSS compliance
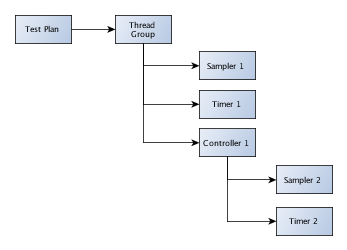
We can see that we defined a Test Plan with a Thread Group, which must be defined in every test plan. Then there are two Sampler elements, two Timer elements and one Controller element. We’ve said that we must apply all elements to the Sampler and Controller elements, which is why we can present the problem differently like this:
- Sampler 1: None
- Sampler 2: None
- Controller 1: None
Now we can assign the two Timer elements to the appropriate Controller and Sampler elements. From the picture above, we can see that Timer 1 belongs to all elements, since it’s a direct child of the Thread Group. The Timer 2 element is a direct child of Controller 1, where it belongs. But we also said that all Controller elements are automatically added to its Sampler elements too, which is why the Time 2 element also belongs to the Sampler 2 element. The Timer elements are then added to the Controller and Sampler elements like this:
- Sampler 1: Timer 1
- Sampler 2: Timer 1, Timer 2
- Controller 1: Timer 1, Timer 2
Besides the scope, we must also talk about the execution order, which is the following:
- Configuration elements
- Pre-Processors
- Timers
- Sampler
- Post-Processors
- Assertions
- Listeners
Now we have a basic idea of how the elements are applied to the Sampler elements, which actually send the requests to the target application.
3. Conclusion
Now it is the time to look at some action and actually run performance testing on the most widely used target applications. When doing a penetration test, we often need performance testing of certain web pages (HTTP or HTTPS), but performance testing of a MySQL database and POP3 mail server are equally important.
Part3
1. Summary
We’ve already described most of JMeter in part 1 and part 2, but let’s summarize what we’ve learned so far. We’ve seen that JMeter consists of the following elements:
- Thread Group: A mandatory element that specifies the number of concurrent users that will use the target application.
- Sampler: Sends requests to the server and waits for a response.
- Logical Controller: Specifies when to send requests from samplers.
- Assertion: Uses a regular expression to group interesting strings from the responses.
- Pre-processor: Executes some actions before a request is sent.
- Post-processor: Executes some actions after a response is received.
- Listener: Listens for responses, saves and analyzes them.
- Timer: Can be used to delay sending of requests between two subsequent requests.
- Configuration Element: Can be used to add or modify requests, but cannot send requests.
2. Testing Website Performance
Let’s pretend for a second that we’re doing a penetration test and our customer wants us to do a performance analysis of a specific web page. We know that the web page runs on both HTTP and HTTPS, which we must test. When testing the performance of any kind of target application, we must ask ourselves the following questions [1]:
1. What is our anticipated average number of users (normal load)?
2. What is our anticipated peak number of users?
3. When is a good time to load-test our application (i.e. off-hours or weekends), bearing in mind that this may very well crash one or more of our servers?
4. Does our application have a state? If so, how does our application manage it (cookies, session-rewriting, or some other method)?
5. What is the testing intended to achieve?
2.1. Intercepting Requests with Burp
First we must intercept the requests we would like to send with JMeter with Burp. This isn’t strictly necessary, it’s just an easier way to imagine what we’ll need to set in the JMeter.
A request can be as simple as something like the following:
GET / HTTP/1.1
Or it can also contain a cookie, like this:
GET / HTTP/1.1
Cookie: PHPSESSID=a101scfn1qhkb2kg0ivr0a0i67
Or maybe some other HTTP headers as well:
GET / HTTP/1.1
User-Agent: Opera/9.80
Accept: text/html, application/xml;q=0.9, application/xhtml+xml, image/png, image/webp, image/jpeg, image/gif, image/x-xbitmap, */*;q=0.1
Accept-Language: en
Accept-Encoding: gzip, deflate
Cookie: PHPSESSID=a101scfn1qhkb2kg0ivr0a0i67
After all, the following request should be sent if we authenticated against a web site (for better formatting, a blank line between the POST and arguments was intentionally removed):
POST /login HTTP/1.1
action=login&user=admin&pass=admin
We must know what we would like to do when testing the performance of a web page and set JMeter accordingly.
2.2. Intercepting Responses with Burp
Requests are only half of the story. We must also take a look at responses. If nothing else, we would at least like to know what we’ve gotten back from the web server, if anything at all.
The most simple response can be something like:
HTTP/1.1 200 OK
Server: nginx/0.7.59
Date: Fri, 31 Aug 2012 16:41:44 GMT
Content-Type: text/html; charset=utf-8
Connection: keep-alive
Content-Length: 112538
[HTMP RESPONSE]
But a response can also return a Cookie when we’ve successfully authenticated:
HTTP/1.1 302 Found
Set-Cookie: uid=895376952; expires=Wed, 02-Apr-2014 09:23:40 GMT; path=/
Content-Length: 0
2.3. The Thread Group
First we must add a Thread Group, which can be seen in the picture below:
We have to set the following options:
- Number of Threads: The number of simultaneous users that will visit the web page in a configured time frame.
- Ramp-Up Period: How much time to wait after starting each thread (user) and before starting a new one; how much time to take to start up all the threads/users. If the ramp-up period is 10 seconds and we have 1000 threads, then all 1000 threads need to be started by the end of 10 seconds, which means that JMeter will start the next thread 10/1000 = 0.01 seconds after it started the previous thread.
- Loop Count: How many times to repeat the whole test.
Here we must think about what we would like to achieve. We would like to test the performance of a web page, but how? The best way is to simulate a different number of users and actually perform a couple of tests. We can test the performance of a web site if we use the following number of users:
|
#Users |
Ramp-Up Period |
|
100 |
unknown |
|
1000 |
unknown |
|
5000 |
unknown |
|
20000 |
unknown |
We can see that the ramp-up period is unknown at a time, but we’ll measure the best ramp-up period for the 1000 number of users in part 4 of this series. For now, let’s look at how to configure sending requests and receiving responses with JMeter.
2.4. Adding JMeter Elements
After we’ve decided how many users we would like to simulate, it’s time to determine what JMeter elements we need. We’ll take a look at an example request/response that we would like to send to the target web site for processing.
2.4.1. Sending the Request
First, let’s take a look at the request that’s presented in the picture below:
We can see that different parts of the request are colored differently. Each of the different colored parts of the request is represented by a different element in JMeter. This is because we can’t really present the whole request with one element in JMeter; this was done for usability and extendability in mind, so that JMeter can be used to assemble even the most complicated requests.
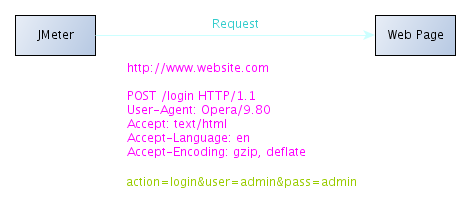
It’s about time to present the elements we have to use to assemble the above requests. The needed elements are:
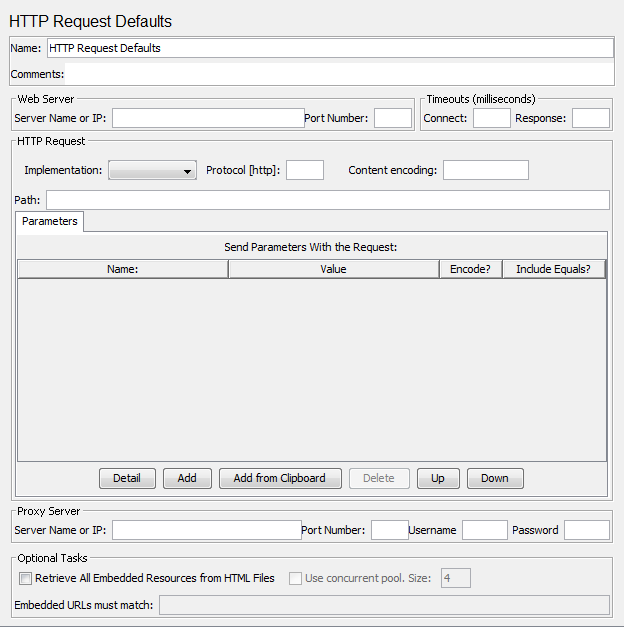
a) HTTP Request Defaults (color: pink)
This element can be added by right-clicking on the Thread Group and selecting: Add – Config Element – HTTP Request Defaults. This element specifies the default settings that each HTTP request will be using. It is here that we specify the target address where we’ll be sending our requests. This can be seen in the picture below:
Notice how we set the “Server Name or IP” to http://www.website.com, which is part of our request. We also specified the “Path” setting, which specifies the resource that we’re requesting from the target web site. We also remembered to define the appropriate HTTP headers. But when running the above configuration we receive the following error:
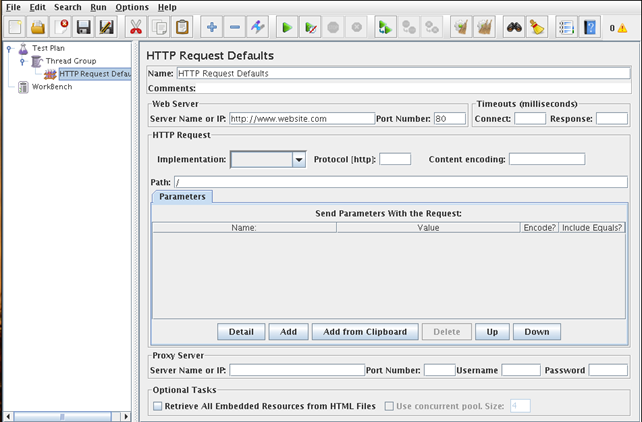
<httpSample t=”0″ lt=”0″ ts=”0″ s=”false” lb=”Error: ” rc=”Non HTTP response code: java.lang.IllegalArgumentException” rm=”Non HTTP response message: URI can't be null.” tn=”Users 1-1″ dt=”text” by=”1141″/>
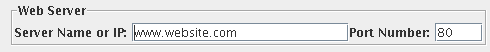
But why? It’s because we specified the “http://” in the server name; we should leave the http:// part out and specify only the hostname or IP. The picture below contains the correctly specified “Server Name or IP”:
Want to learn more?? The InfoSec Institute CISSP Training course trains and prepares you to pass the premier security certification, the CISSP. Professionals that hold the CISSP have demonstrated that they have deep knowledge of all 10 Common Body of Knowledge Domains, and have the necessary skills to provide leadership in the creation and operational duties of enterprise wide information security programs.
InfoSec Institute's proprietary CISSP certification courseware materials are always up to date and synchronized with the latest ISC2 exam objectives. Our industry leading course curriculum combined with our award-winning CISSP training provided by expert instructors delivers the platform you need in order to pass the CISSP exam with flying colors. You will leave the InfoSec Institute CISSP Boot Camp with the knowledge and domain expertise to successfully pass the CISSP exam the first time you take it. Some benefits of the CISSP Boot Camp are:
- Dual Certification - CISSP and ISSEP/ISSMP/ISSAP
- We have cultivated a strong reputation for getting at the secrets of the CISSP certification exam
- Our materials are always updated with the latest information on the exam objectives: This is NOT a Common Body of Knowledge review-it is intense, successful preparation for CISSP certification.
- We focus on preparing you for the CISSP certification exam through drill sessions, review of the entire Common Body of Knowledge, and practical question and answer scenarios, all following a high-energy seminar approach.
This element simply defines the values that the HTTP request elements use and does not in any way send the actual request.
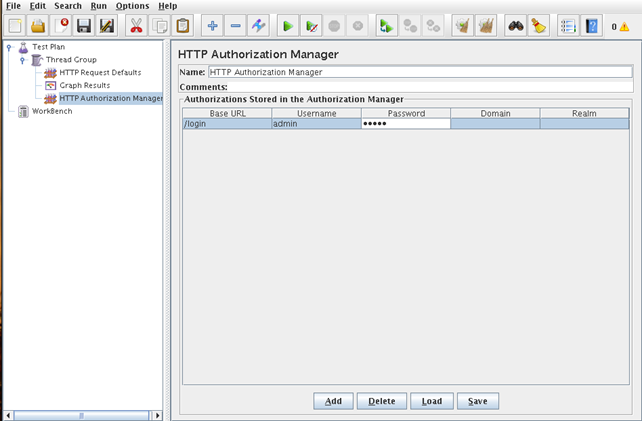
b) HTTP Authorization Manager (color: green)
This is an element which will be used to authenticate the user when a /login path is requested. The configuration of this element can be seen in the picture below:
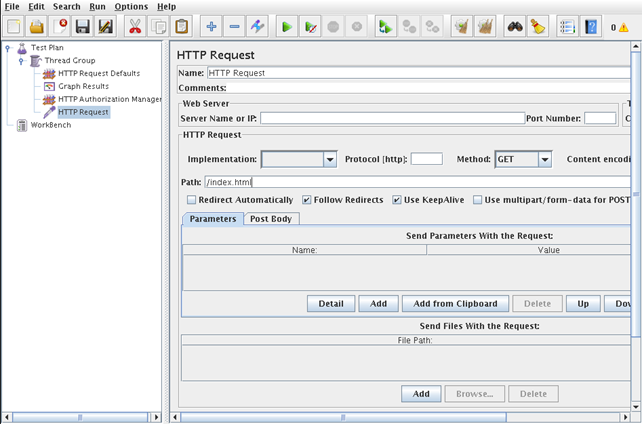
c) HTTP Request (color: blue)
After all is set-up, we must of course send the request to the target application. To do that we need to right-click on Thread Group and select: Add – Sampler – HTTP Request. The request looks like the picture below:
We can see a lot of options that we can set, which are very similar to the “HTTP Request Defaults” element. We have to change the Path, which indicates what resource we’ll be requesting. Note that we don’t have to specify the “Server Name or IP”, because if not given, it’s taken from the “HTTP Request Defaults” element. We can add as many HTTP Request elements as we wish and all requests will be sent in turn one after the other.
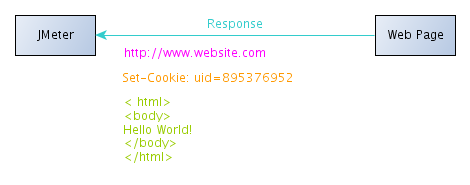
2.4.2. Receiving the Response
Now we’ve successfully written our request. What’s left is the response. The response can be represented by the picture below:
To construct a response, we need the following elements:
a) HTTP Request Defaults (color: pink)
We already described this element when defining a request, so we won’t repeat ourselves.
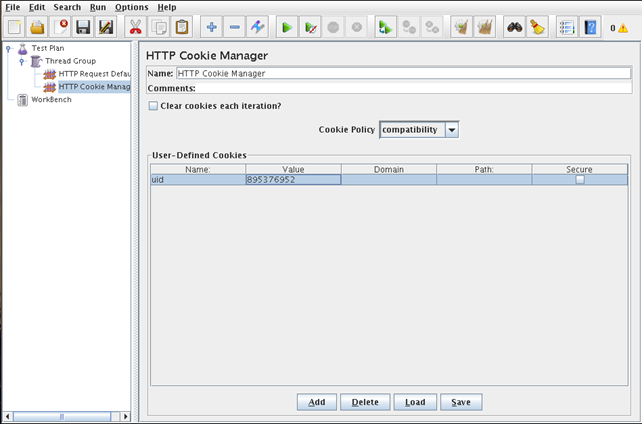
b) HTTP Cookie Manager (color: orange)
If we want to use cookies in requests we need to add HTTP Cookie Manager by right-clicking on a Thread Group and selecting: Add – Config Element – HTTP Cookie Manager. The configuration of cookies can be seen in the picture below:
c) Graph Results Listener (color: blue)
This elements receives the response of the request, stores it, analyzes it, and presents the findings in a graph. We can add this listener by right-clicking on the Thread Group and selecting: Add – Listener – Graph Results. We can optionally specify the file where to save all the responses for future analysis, but this field isn’t necessary.
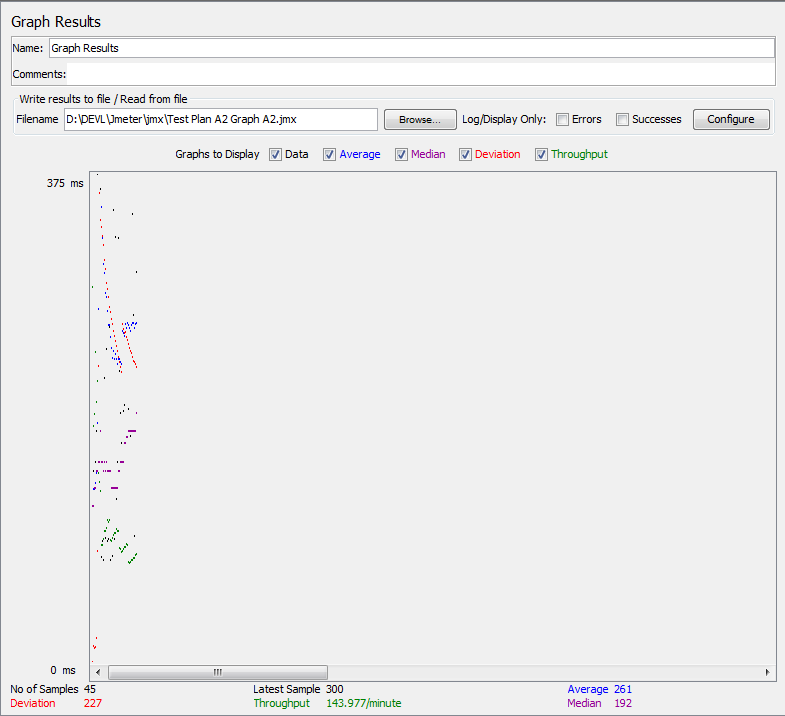
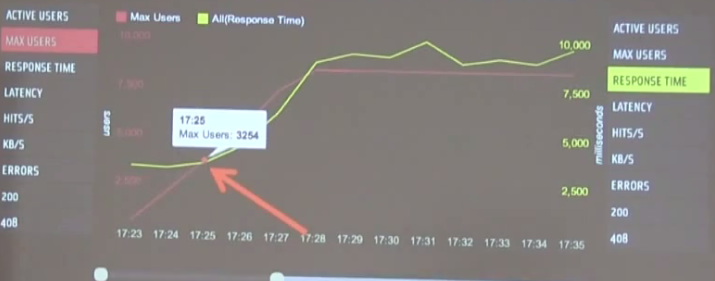
The picture below presents a graph of a test plan, where we simulated 1000 users which accessed the default /index.html resource on www.infosecinstitute.com (with ramp-up period 10):
Illustration 1: Graph results of testing the performance of InfoSec Institute.
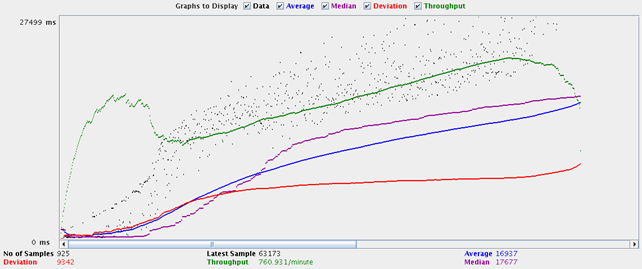
At the bottom of the picture there are the following statistics, represented in colors:
- Black: The total number of samples sent.
- Blue: Average of all samples sent.
- Red: Standard deviation.
- Green: Throughput rate, that represents the number of requests per minute the server handled. This number takes into account all delays we added to the test plan. We can lower/raise the number of simulated threads to find out the maximum throughput the server can handle.
3. Conclusion
We’ve seen what elements we need to set when sending a request and receiving a response: this should be enough to perform the performance test of any server.
References:
[1] Help! My boss wants me to load test our web app, accessible on http://jmeter.apache.org/usermanual/boss.html.
JMeter Meetup
Part1
What is JMeter
- An apache project used by a large, open source community
- Comprehensive protocol coverage and scripting capabilities
- Test scripts realistically and accurately – simulates any scenario
- JMeter is the de-facto load testing software for the open source community
What can you do
- Comprehensive Scripting
- Graphical UI and/or various scripting languages ( e.g. javaScript, BSH, JAVA)
- Scalable load testing
- Platform agnostic
Facebook Microsoft Java Mobile Web Services DB More
- Parameter extraction
- Assertions
What are JMeter’s Limitations
- JMeter is not a browser
- Limited support for JavaScript, AJAX and complicated frameworks ( e.g GWT )
- <300 threads per engine ( can go for more – but don’t tell anyone )
- individual ‘users’
- run through steps, with varying parameters
- Everything goes through the console ( inherent bottleneck)
- <200 users not a problem
- larger loads have issues because they all go through once console
- A memory consuming beast
- crashes can occur and things get lost when it bombs
- Limited reporting capabilities under a heavy load
- Scale with caution
Use Case: Testing an extra-large facebook app
Goals of Large Scale testing
- Software architecture
- Physical architecture
- Disk IO
- Cnnections
- Bandwidth
- Locking
As things scale up, hardware starts to come into play such as: disk IO speed, memory bandwidth, etc.
What’s Your Lab Like?
- Hand me down
- Works of art
- Shared
- Cloud
Amazon Elastic Beanstalk
- EC2 original layer
- Autoscaling layer on top of EC2
- Deployment Pipeline
- Zero downtime deployments
- CloudFront, ElastiCache, Route 53
Other
- Runs in Tomcat
- Lightweight
- RESTful-ish
- MongoDB
Dream was to have an elastic stack
???Add shards to MongoDB as needed???
Lessons Learned
- Global write lock
- Sharding is a pain
- Routers are fragile
- Performance degrades quickly
- Collection size
- Number of collections
- Document
- It’s really fast and works pretty well
Build Realistic Test Data
- Copy & Sanitize existing data
- Keep it simple
- Don’t build a console app
- http://myapp.elasticbeanstalk.com/plt/seed
- RandomPlayerGenerator
- Drive it with JMeter
- Distribute it with BlazeMeter
Application Provides Testab ility
- Simple api usable from any client
- Should be atomic: RandomPlayerProvider
- JMeter is good at driving concurrency and collecting data
- BlazeMeter is good a distributing load and reporting results
- Works in tandem with JMeter to even out loads for better testing experience and reliability
Part2 Walkthrough and KPIs
The JMeter Workshop
- Login and Post a request
- Record
- Setup your proxy
- Put each group in to a new controller
- Add a recording controller
- Add HTTP requiest defaults
- Set defaults\
- Add a constant timer
- Add a ‘View Results in Tree’ listener
- Clean
- Parameterize
- Debug
- Test
- Analyze Report
WalkThrough ( Get slide screen caps)
KPIs Available in JMeter Test
Response Time – The Time it takes a request to fully load
- Indicates the performance level of the entire system under test ( web server + DB )
- Represents the average response time during a specific munite of the test
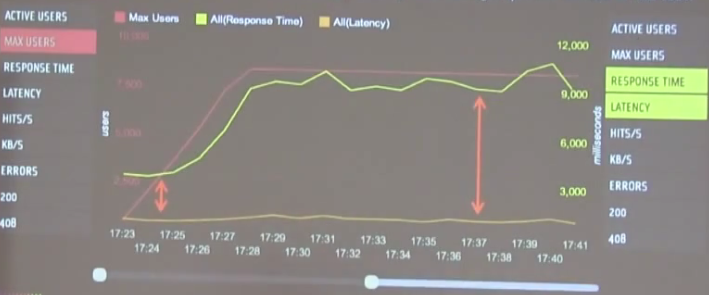
Latency – Time it takes for the first byte to be received
- Indicates the performance level of the web server
- This measurement represents the average latency time during a specific minute of the test
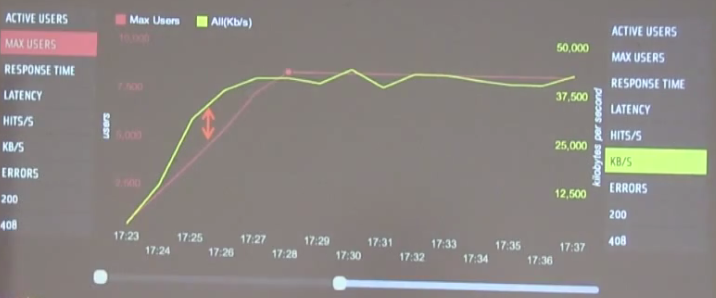
Bandwidth Consumption
- The amount of bandwidth used by a request of set of requests
JMeter Best Practices
Avoid internal bottlenecks – Accept JMeter Limitations
- The number of threads depends on script intensity and complexity
- Usually less than 300
- A test always needs a tune-up
- Don’t expect to script and run on the first try
- Don’t hit your website with everything you’ve got
- Scale slowly and find bottlenecks and sensitivity points
- Remember that the console is a bottleneck
- Record, Clean, Parameterize and debug
- It’s hard to debug large scale tests, Debug locally
Q&A
JMeter with JUnit Request
JUnit Sampler Tutorial- JMeter
Posted on March 16, 2009 by Admin
JUnit sampler provides easy ways to unit test the Java applications. Each Java class that you write will correspond to a JUnit Java class that will test the methods of your class.
For example if you want to test some methods of a class Book you create a class BookTest which extends the JUnit TestCase class and place your test methods in there.( i.e. Create a subclass of TestCase). In this tutorial we create a SampleTest class which has four methods.
Steps:
1. Create a folder (package) mypack inside lib\junit. Put the SampleTest.java file inside it.
2. Since we are importing TestCase class we need to set the classpath for junit.jar file.
|
SampleTest.java |
|
package mypack; import junit.framework.TestCase; public class SampleTest extends TestCase { int a=10,b=5; int c,d,e; public void testsum() { c=a+b; System.out.println(“The Sum of two numbers is: “+c); } public void testmulti() { d=a*b; System.out.println(“The product of two numbers is: “+d); } public void testdiv() { e=a/b; System.out.println(“The division of two numbers is: “+e); } } |
3. Compile the SampleTest.java file
Cmd:\ Jmeterhome\lib\junit\mypack> javac SampleTest.java
4. Now create a jar file for the package mypack;
Cmd:\Jmeterhome\lib\junit> jar cvf mytest.jar mypack
Here mytest.jar is the name of the jar file that will be generated and mypack is the package name getting jarred.
5. Now since the jar file is inside junit folder Jmeter (Junit Sampler automatically detects the class).
6. Run Jmeter and add a JUnit sampler to the thread group.
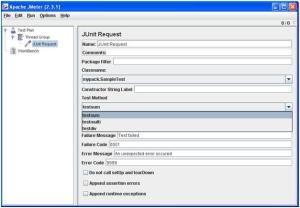
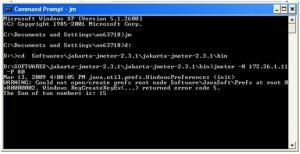
Now check the Classname option in the GUI; mypack.SampleTest has been added to the list.Select any method from the test methods available.Run the test and view the result in a listener.
The command prompt will display the output of the method.
END


- Log in to post comments